Supply Chain Intelligence — 2024 / Supplyframe
Risk Index
Designing a Configurable Risk Metric for Supply Chain Transparency
◆ Company Overview
Supplyframe builds supply chain intelligence tools for the electronics industry.
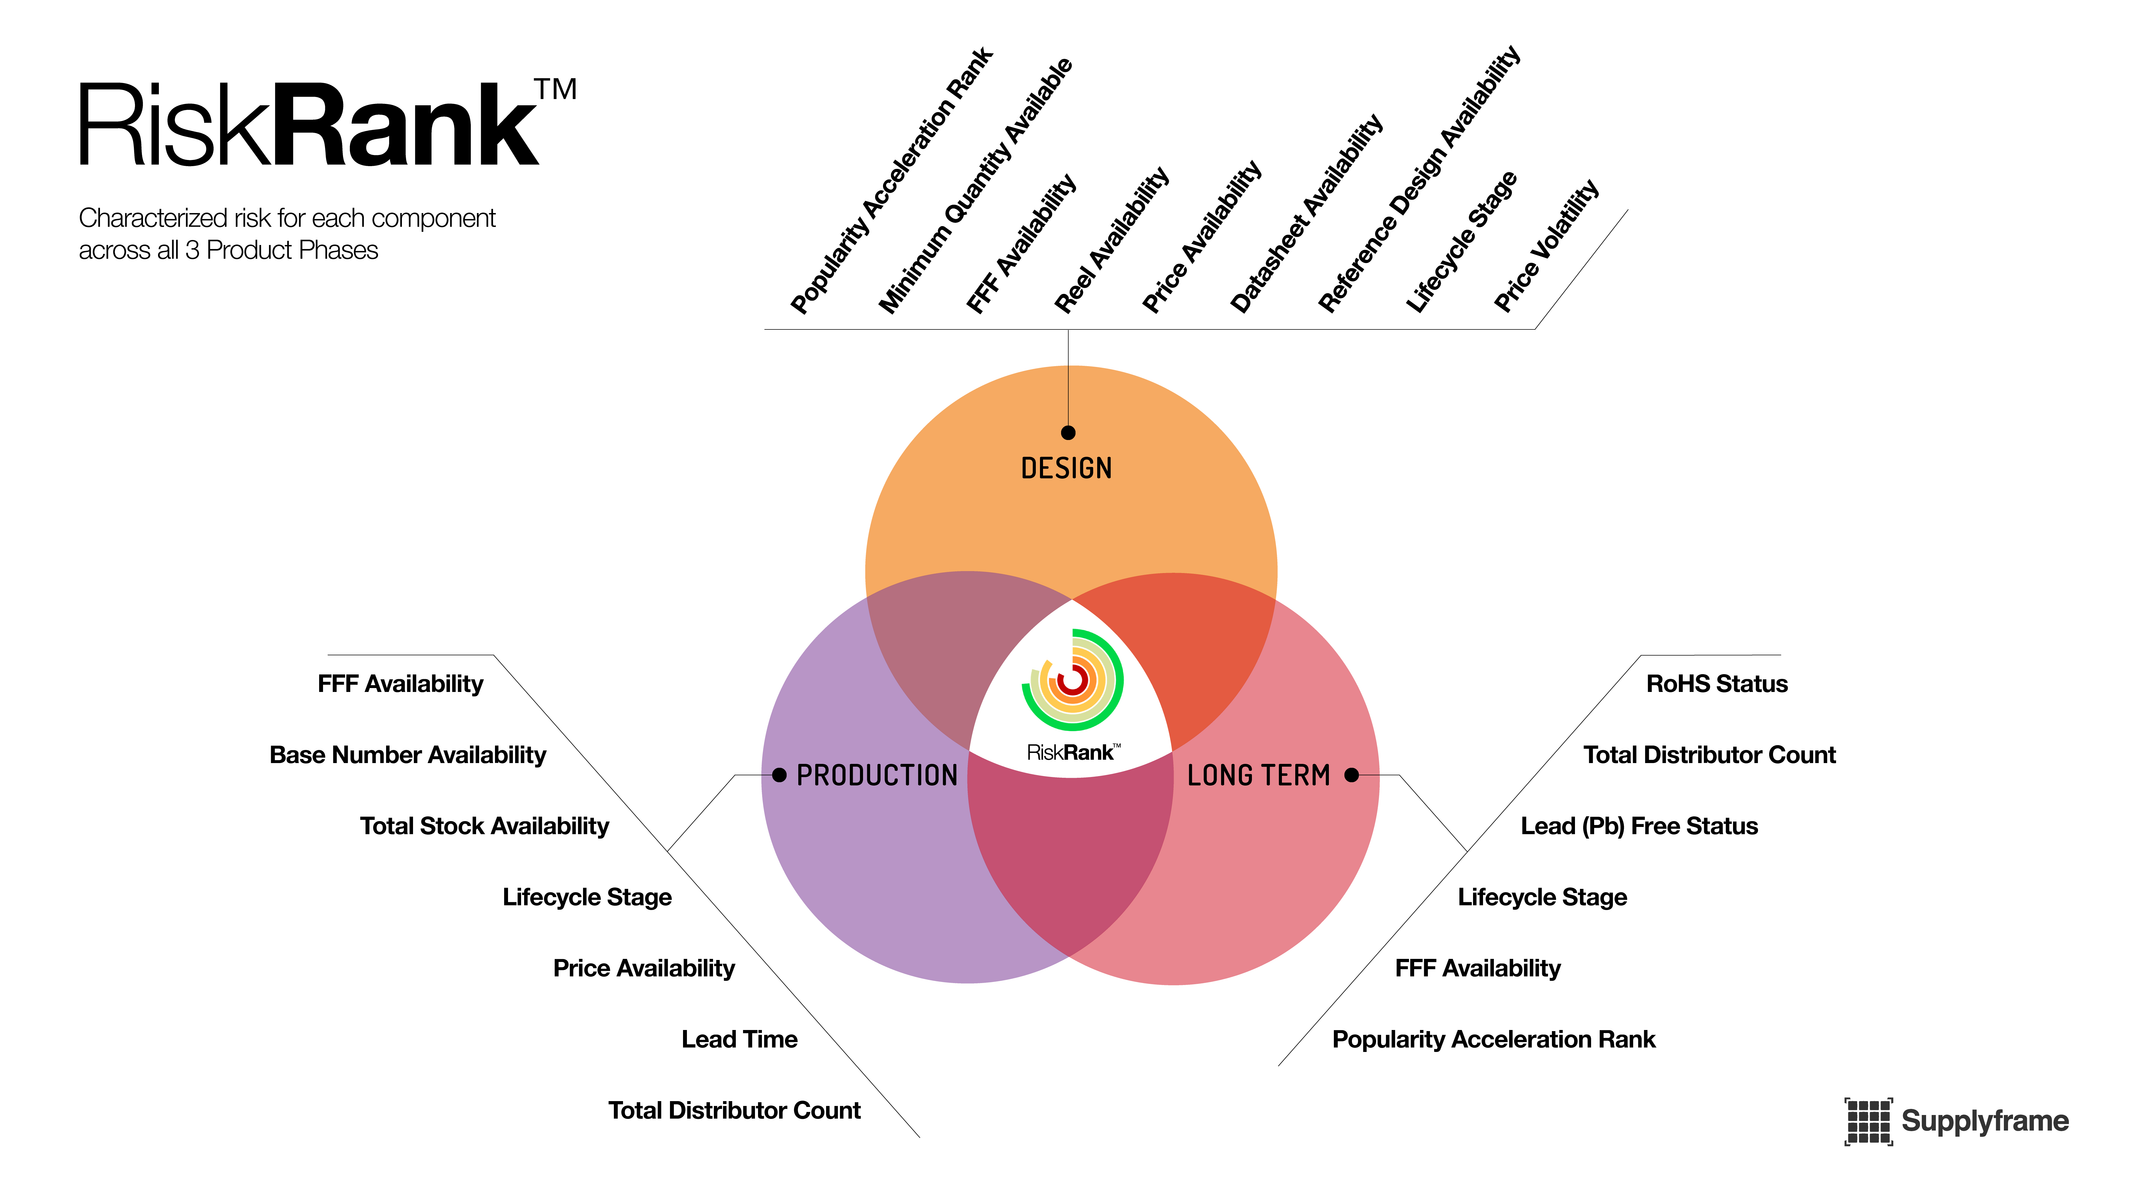
When I joined, the platform's risk metric, RiskRank, was a proprietary algorithm. Users could see a score but not what drove it: no parameter weights, no transparency into the calculation.
In interviews, I kept hearing the same thing: engineers didn't trust a number they couldn't interrogate, so they built their own spreadsheets instead. I partnered with the PM to make a case for a new feature — a risk index that customers could configure themselves. That pitch became the project.
◆ Discovery
15 engineers, 2 channels, 1 clear signal
We recruited 15 electronics engineers through Hackaday's community (part of Supplyframe's network) and warm intros from the sales team. Most worked at small companies managing sourcing decisions with limited tooling. A few came from large OEMs with dedicated procurement teams.
That range was deliberate. I wanted to see how risk assessment practices differed by company size and resources.

The Universal ‘No’: Why Engineers Wouldn't Buy In
Every engineer we spoke to said the same thing: without understanding what goes into the score, they couldn't trust it for business decisions.
“RiskRank is used as a ‘sanity check’. If red, then I investigate further. [Their company] has their own risk assessment driven very much by lead time.”
Design Engineer, Automotive Industry
◆ Design
Where configuration lives matters as much as how it works
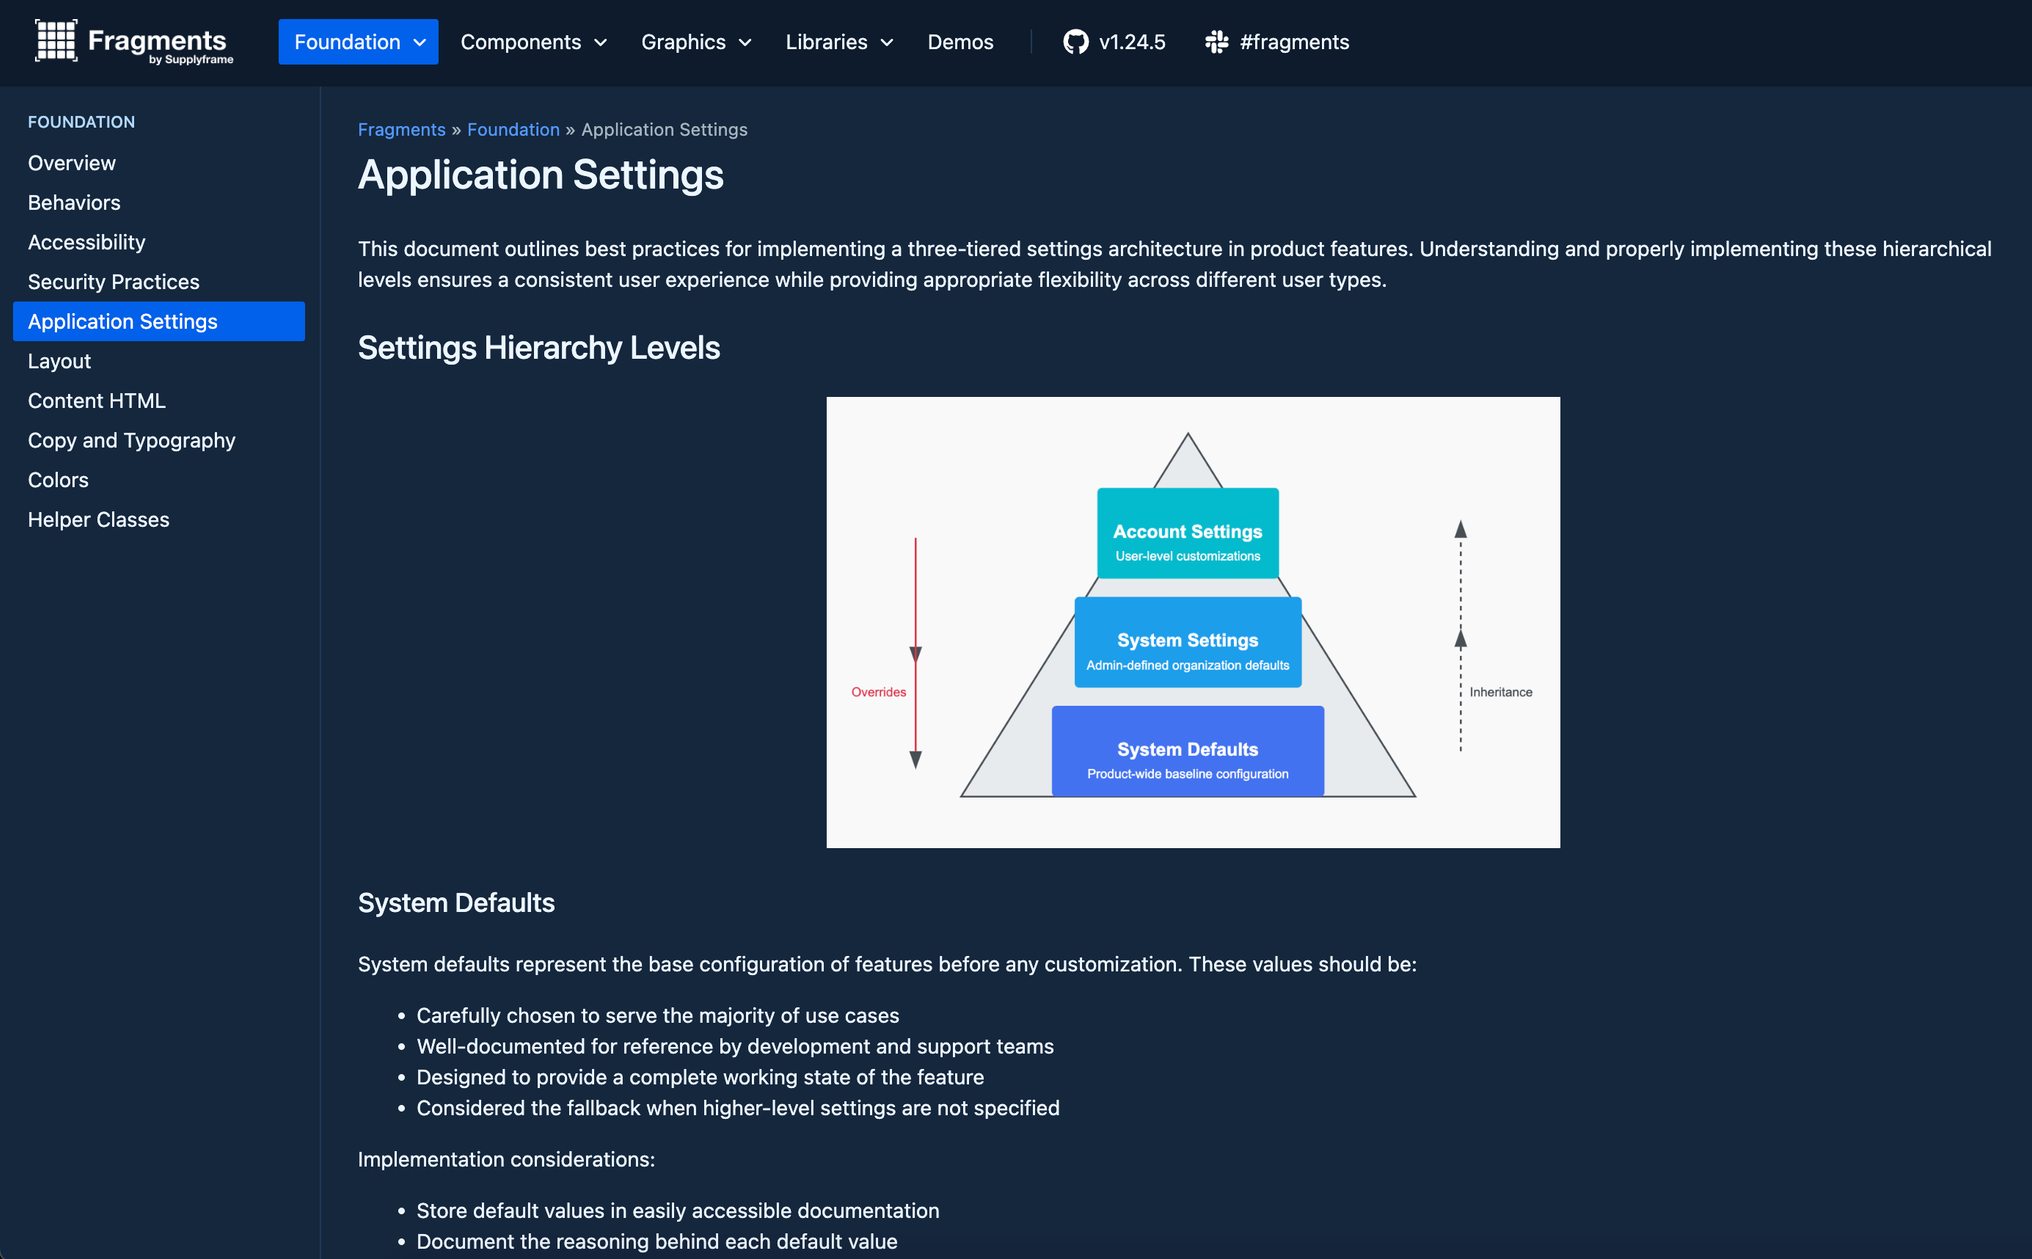
Before designing the UI, I needed to figure out the right architectural layer for this feature. Risk configuration isn't a per-user preference — it's an organizational decision. A procurement manager sets the parameters for their team, not individual engineers.
I mapped this against the settings hierarchy I'd documented in our design system. Risk Index sits in that middle layer — system settings — where managers define how risk is calculated for their entire organization.
The core design challenge
The design problem was straightforward to state and hard to solve: give users full control over risk calculations without making the interface feel like a spreadsheet.
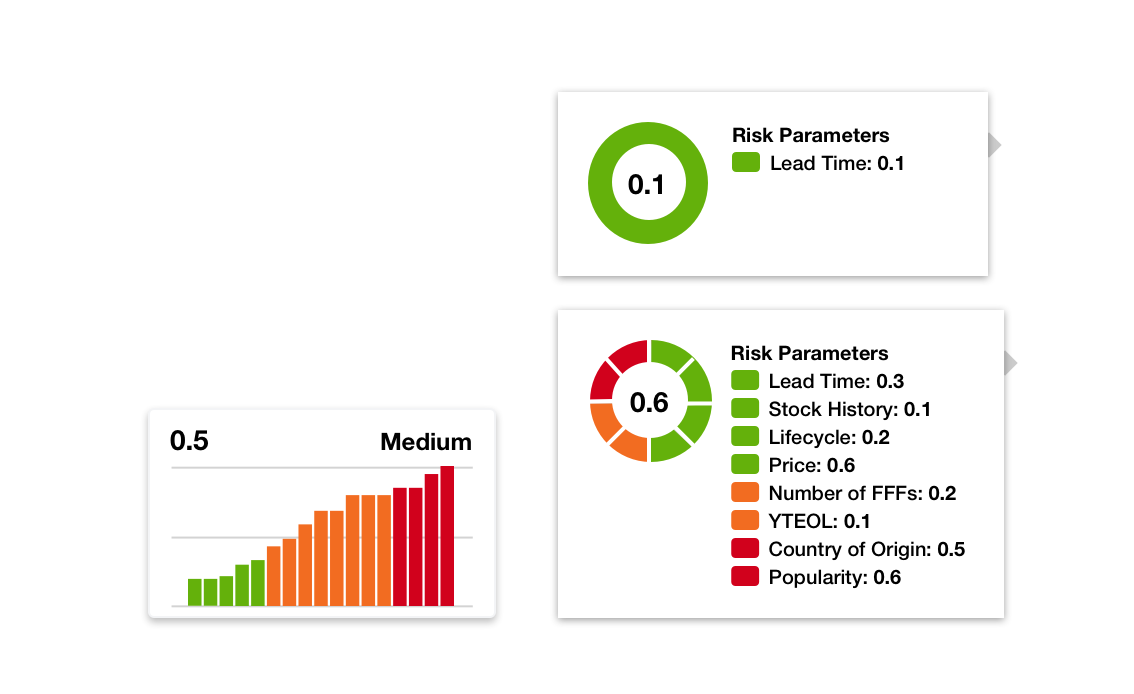
Early wireframes
Visual weight shifts as parameters are added. The gauge reads differently with one factor vs. eight.
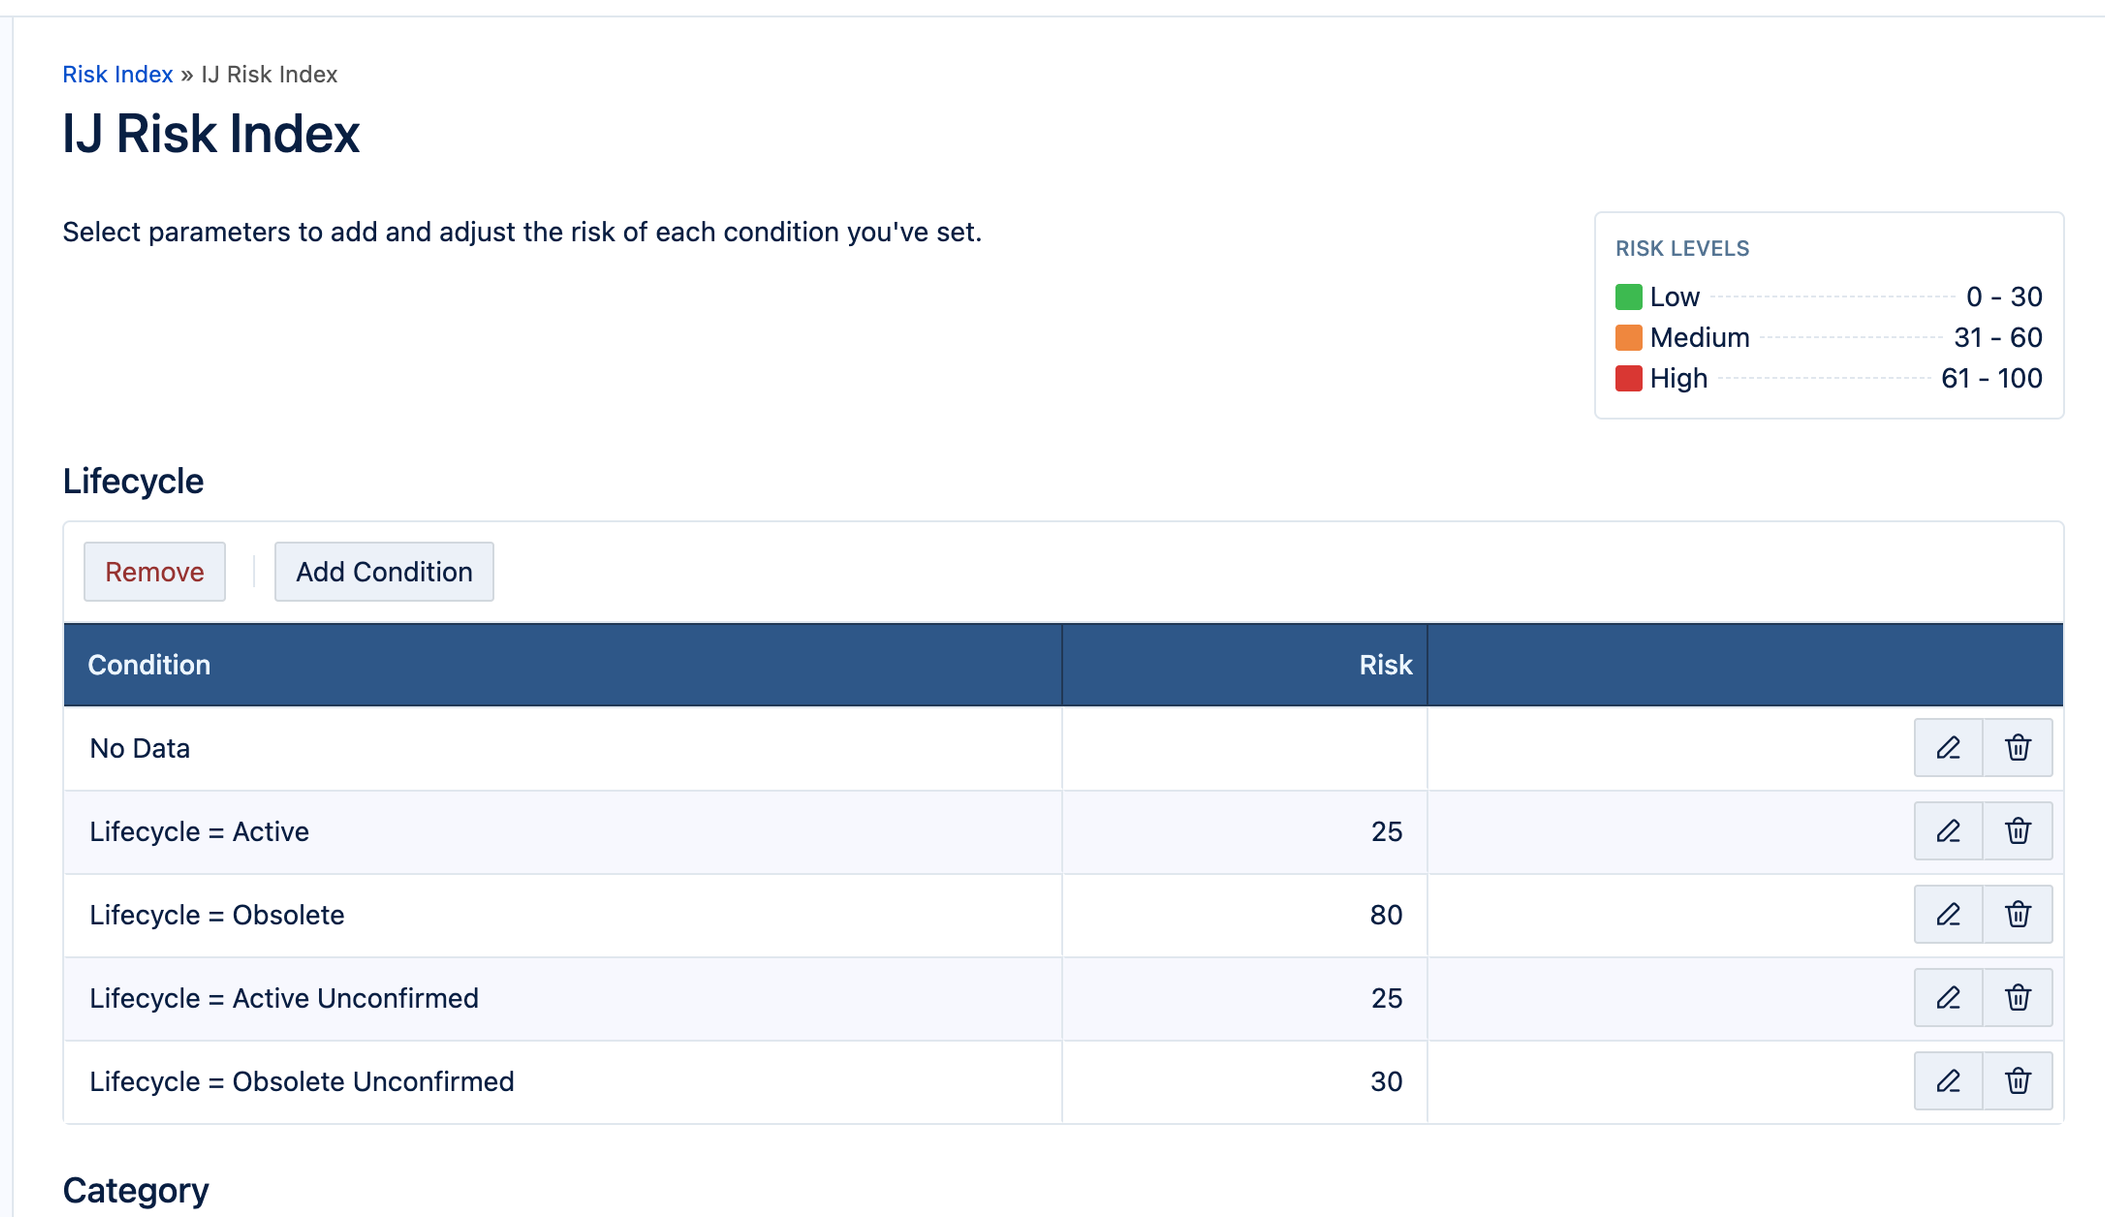
Condition builder
Users define rules per parameter — e.g. "if Lifecycle = Obsolete, risk = 80."
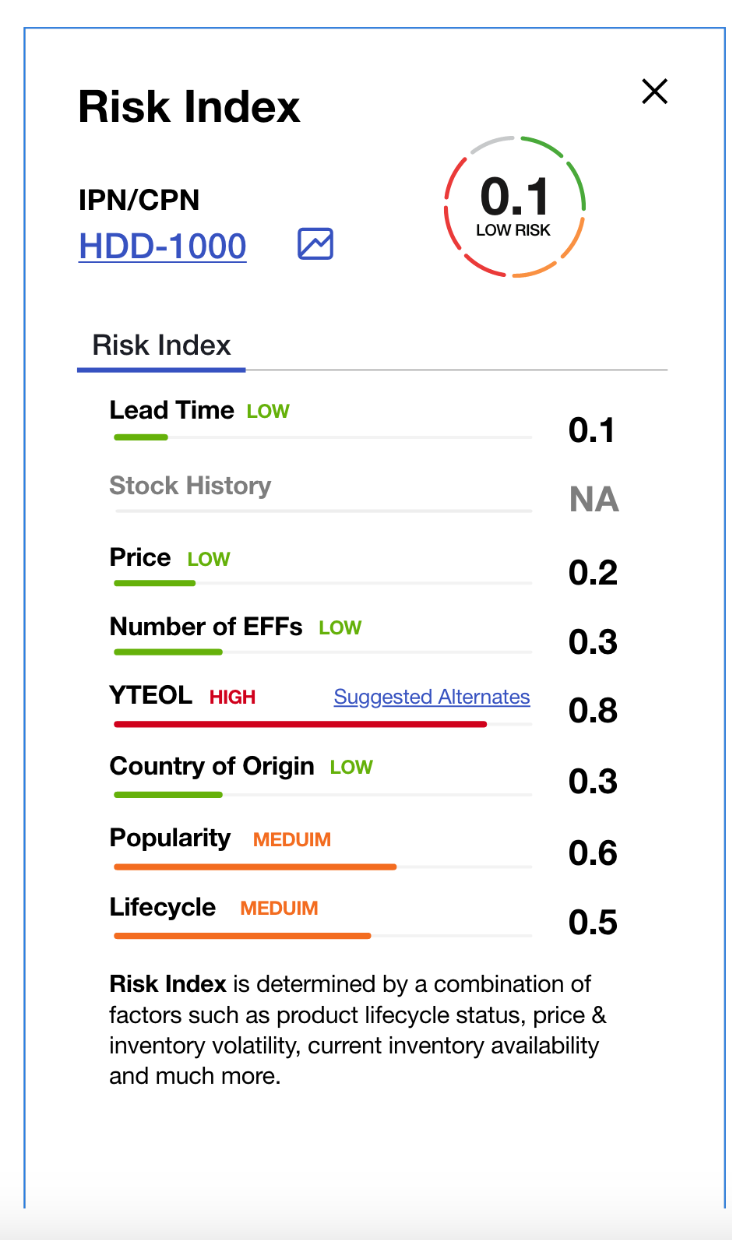
BOM side panel
A slide-out in the main workflow. Engineers check risk on any part without leaving the table.
Shipped: Three surfaces, one risk model
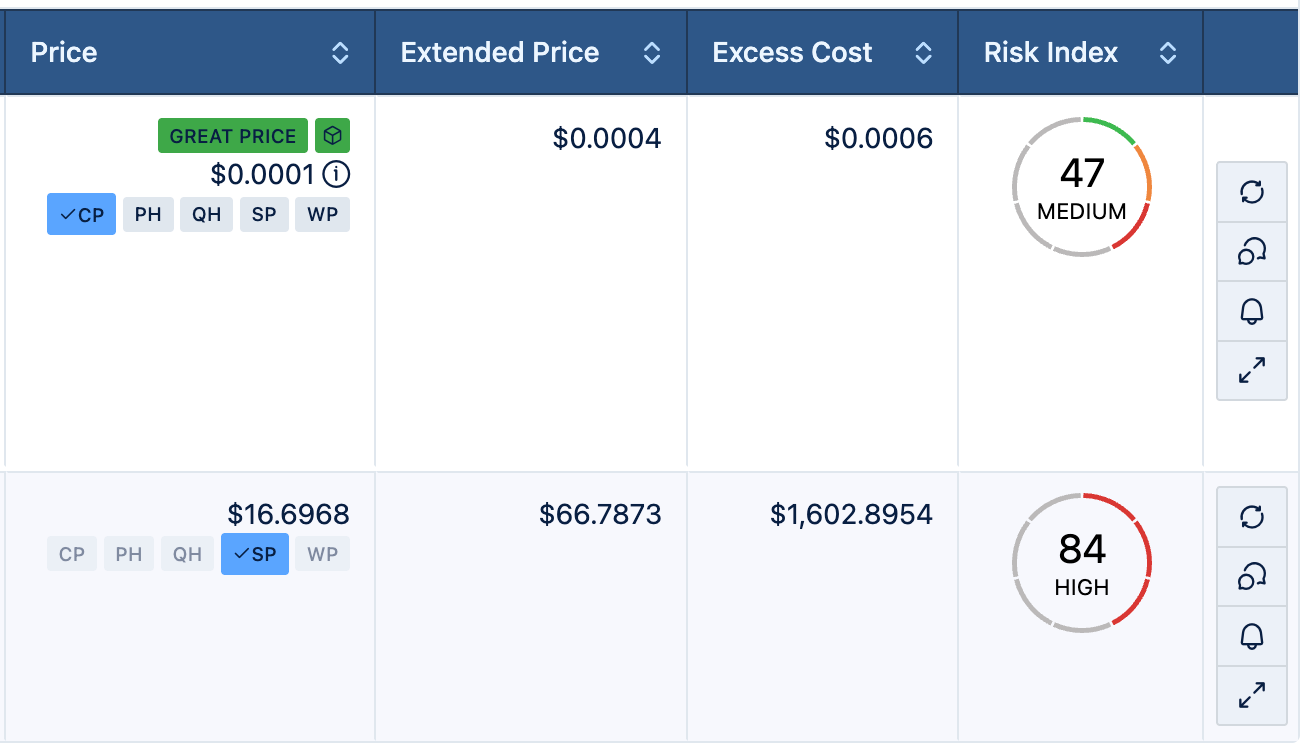
BOM table
Risk Index appears inline at the line-item level, right next to cost and price. No extra clicks to see risk.
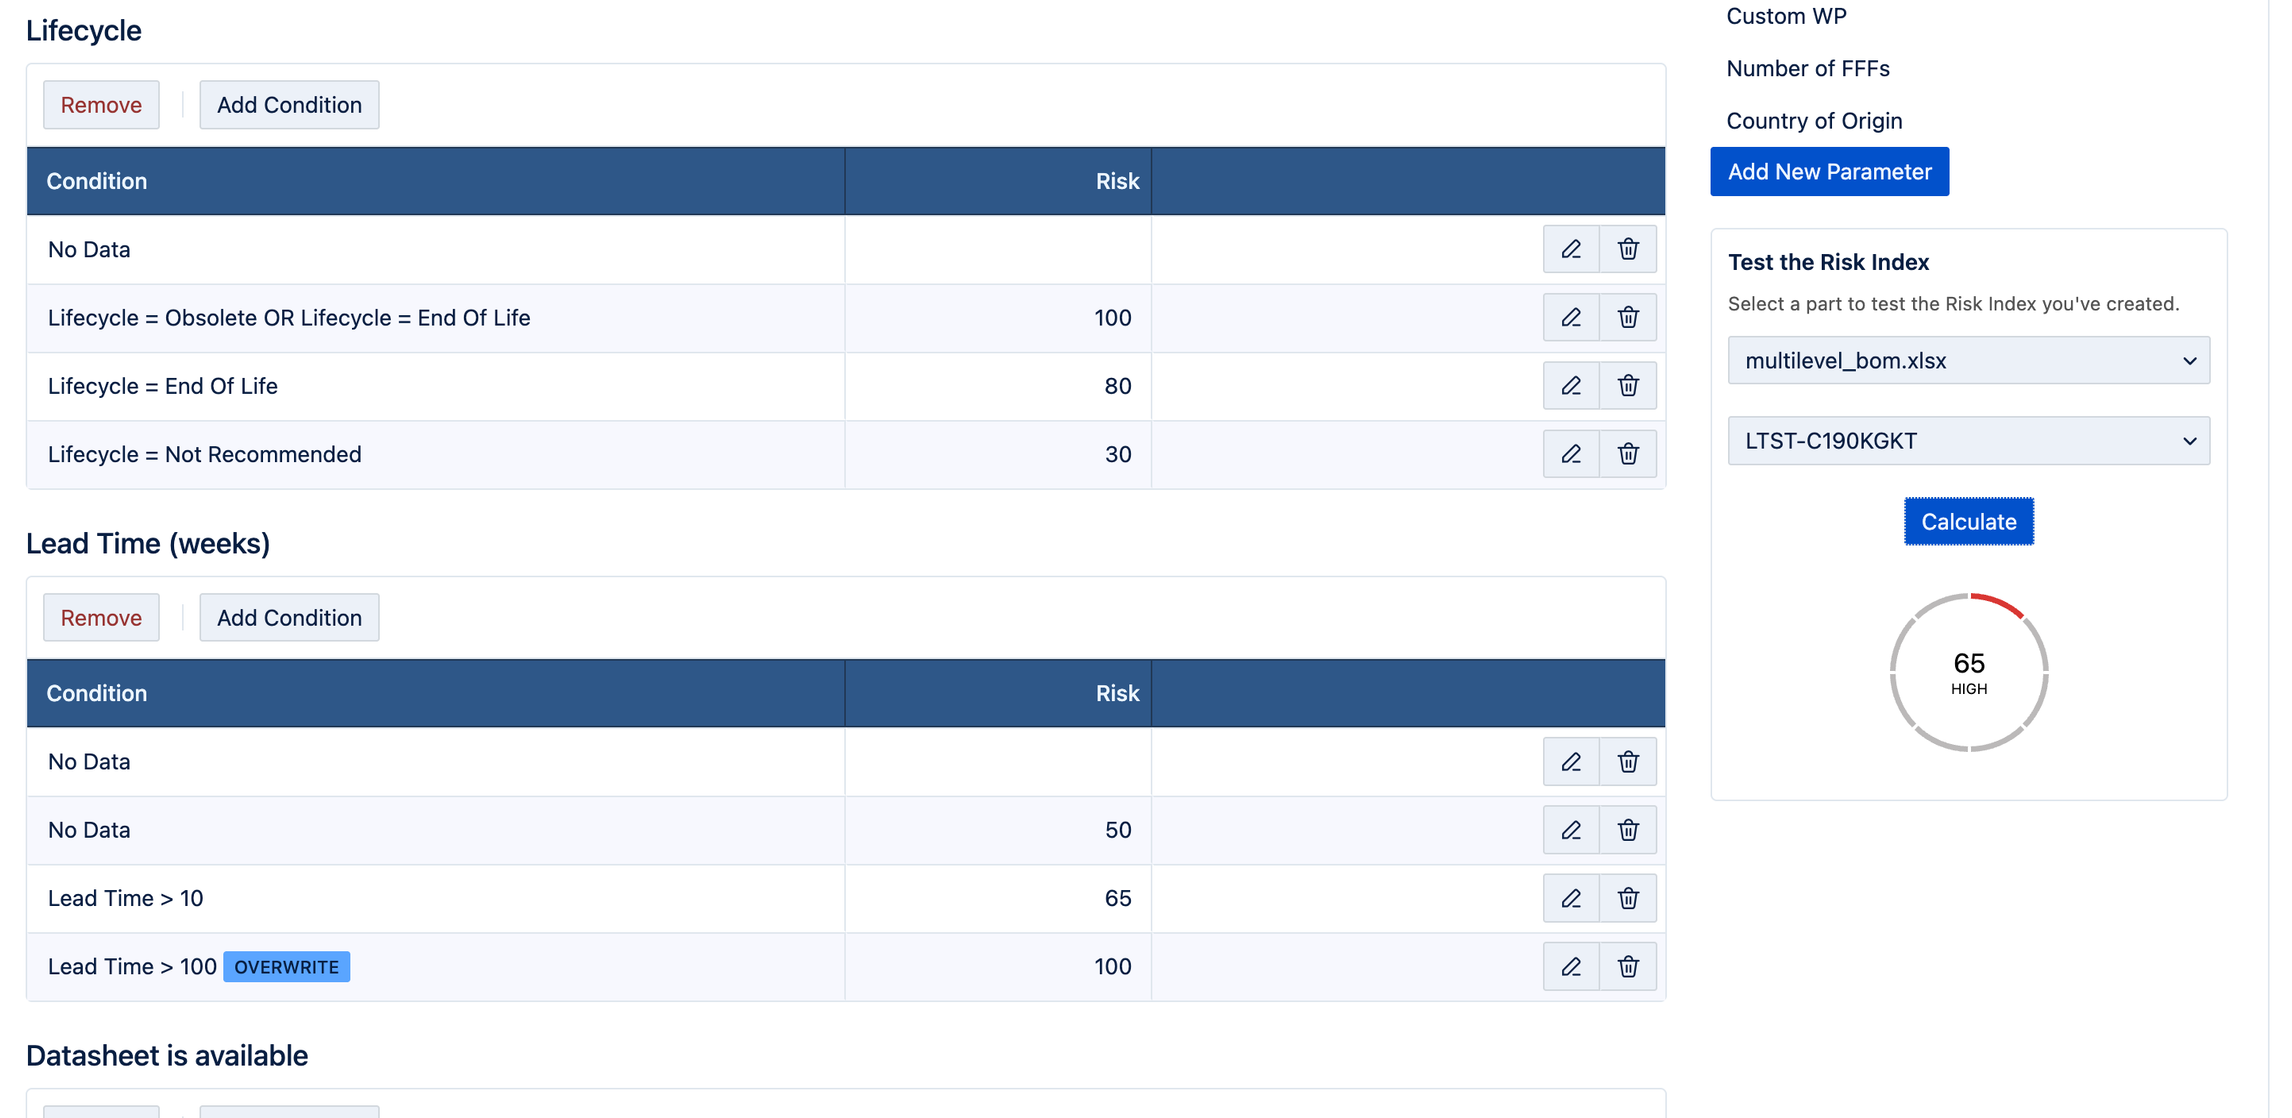
Configuration form
Managers add parameters, set conditions, and test the index against real parts from their BOM before saving.
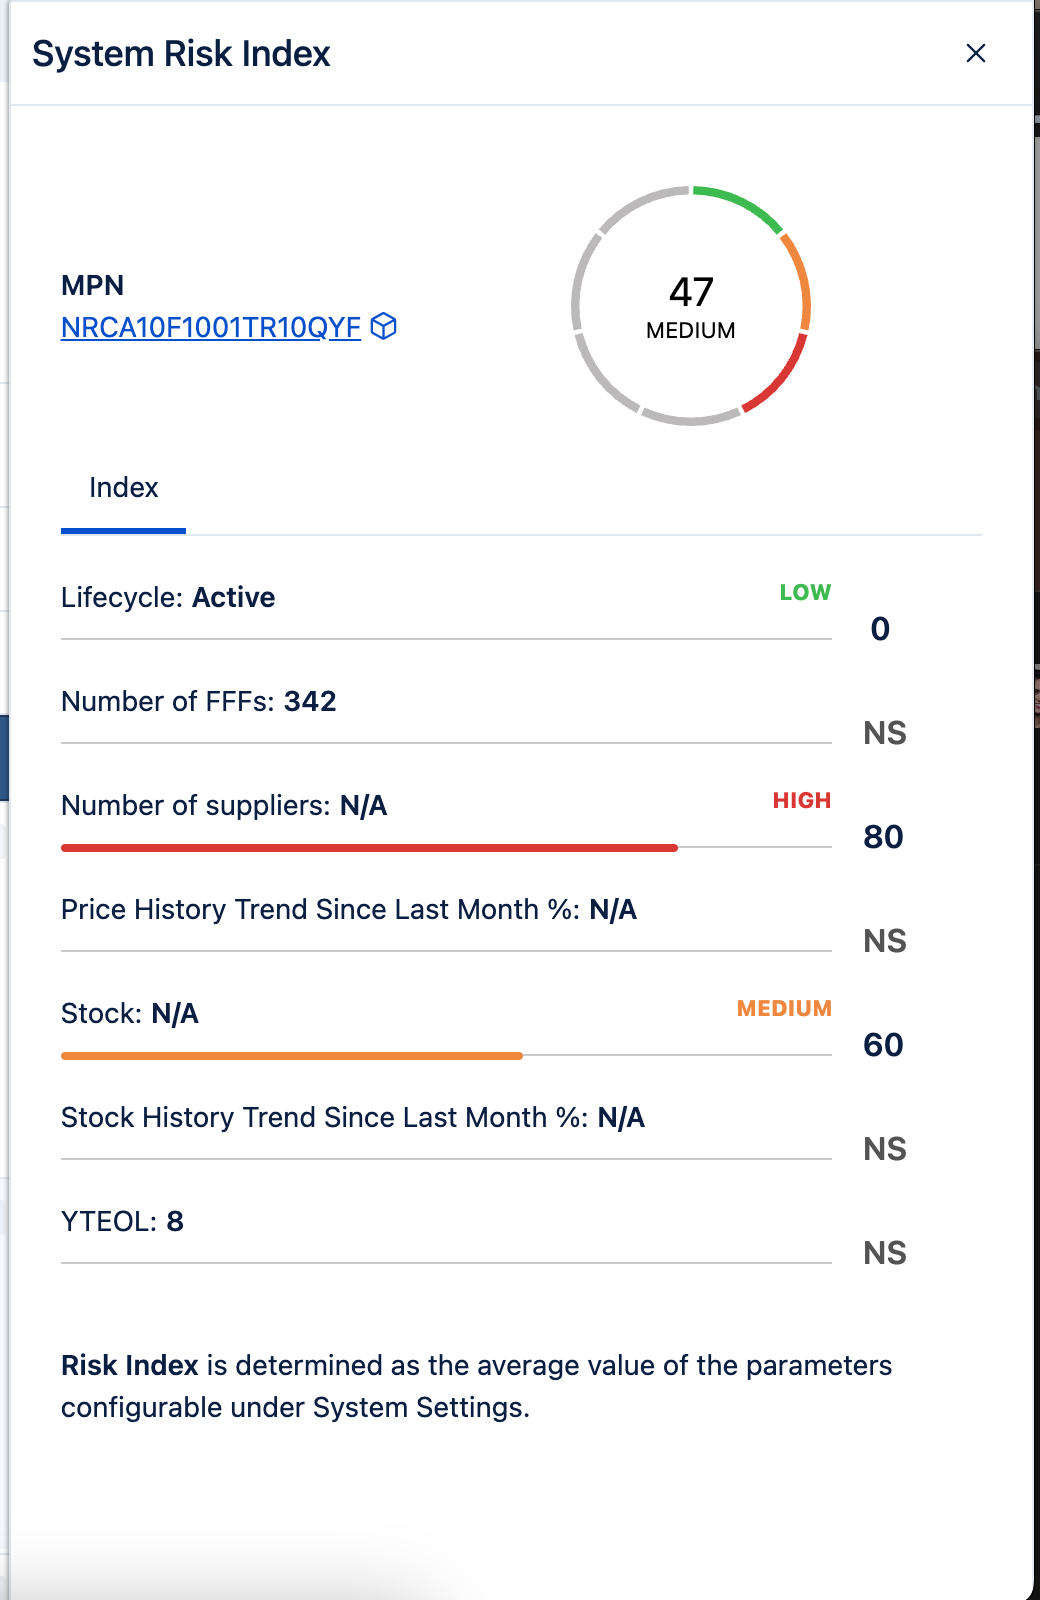
Detail panel
Engineers click into any part to see the full breakdown — which factors drive the score and how each is rated.
Launched with the redesign — not bolted on after
Risk Index shipped alongside Supplyframe's new design system. That timing wasn't a coincidence. I advocated for releasing both together so the feature would debut in the new visual language from day one, rather than launching in the old UI and getting ported later.
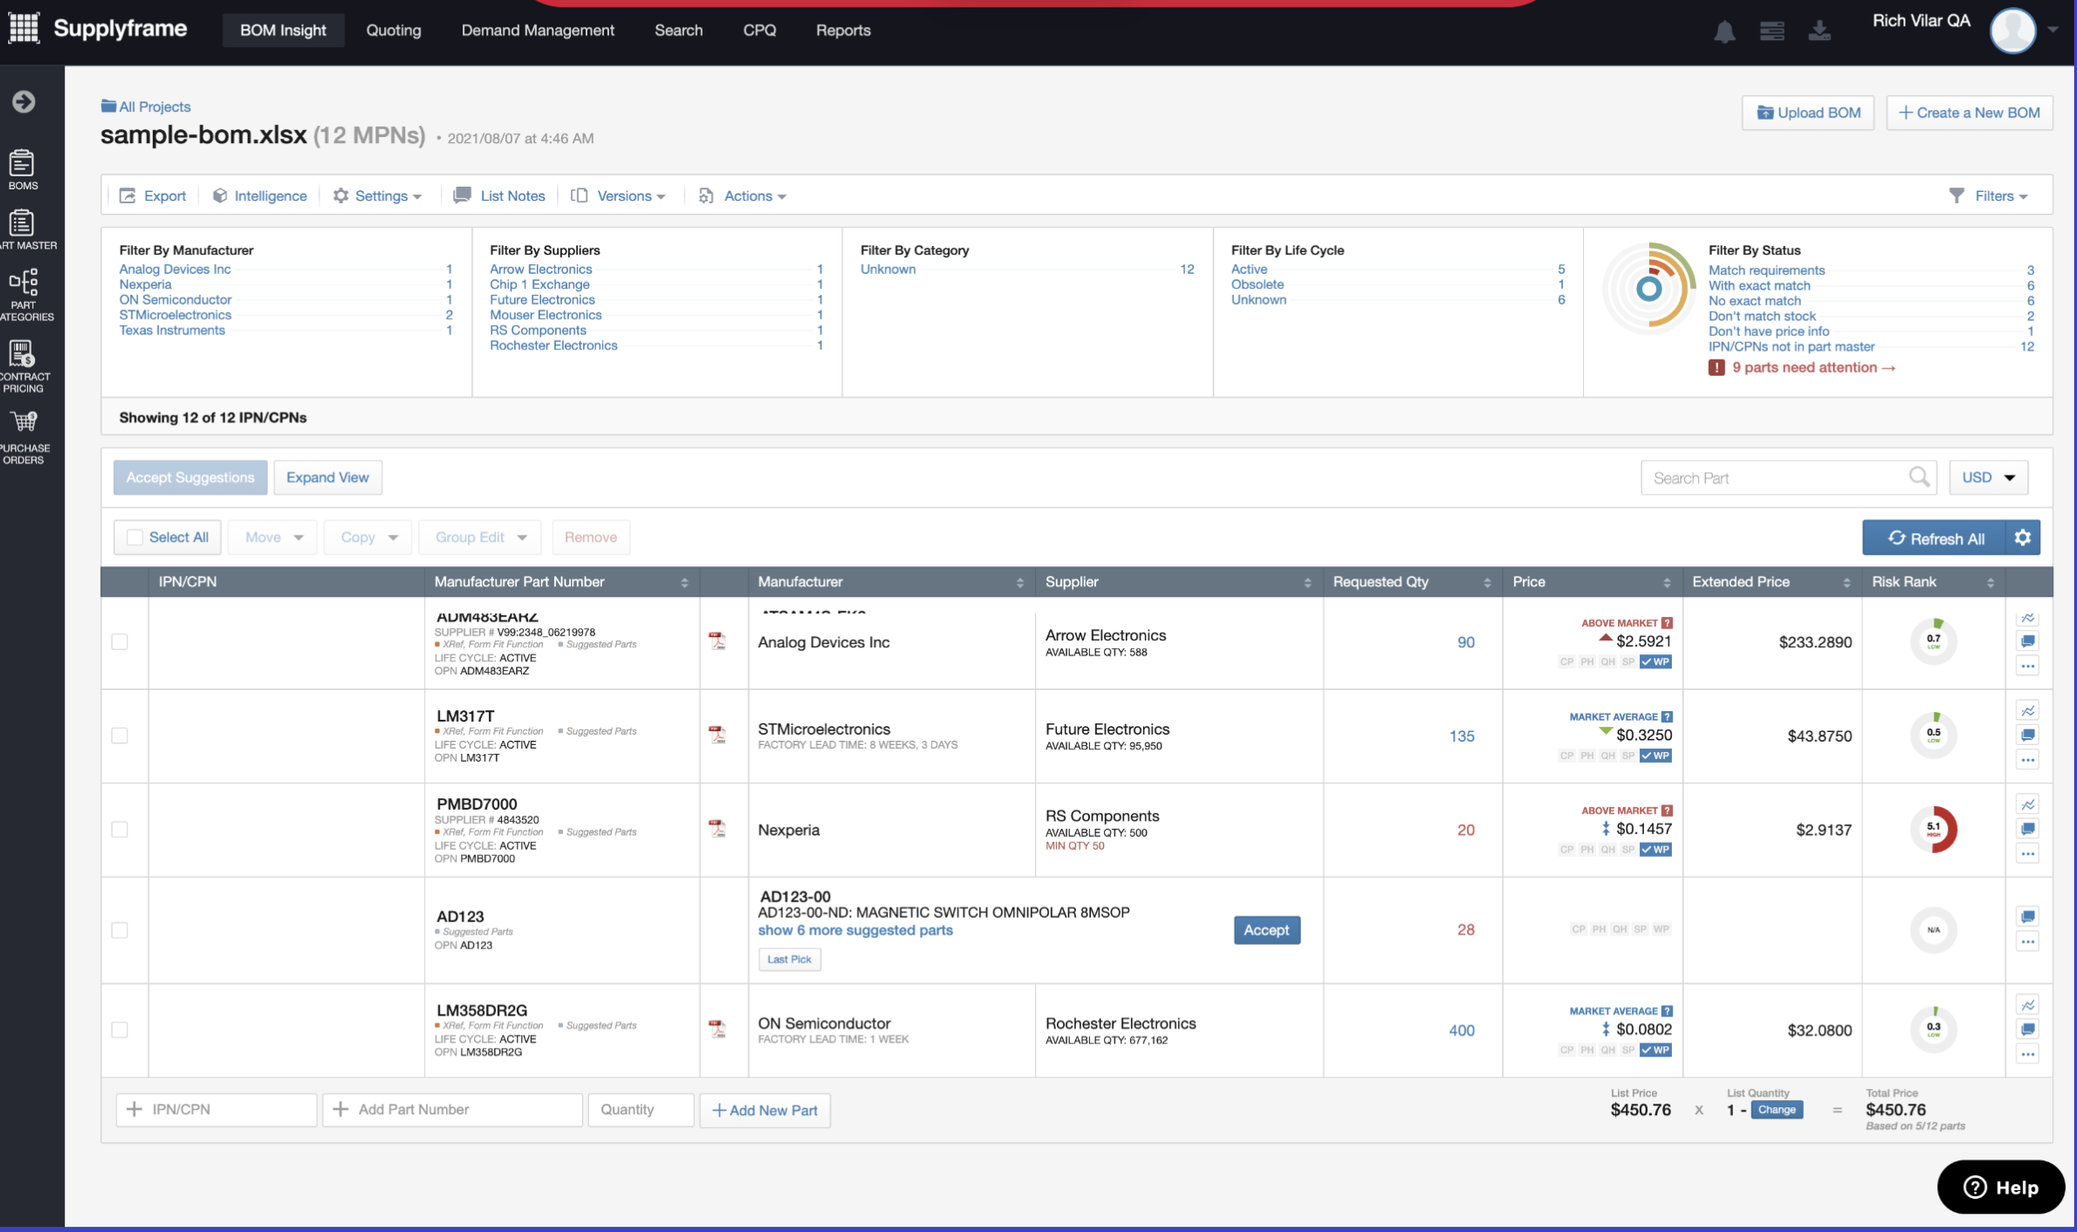
Before — RiskRank
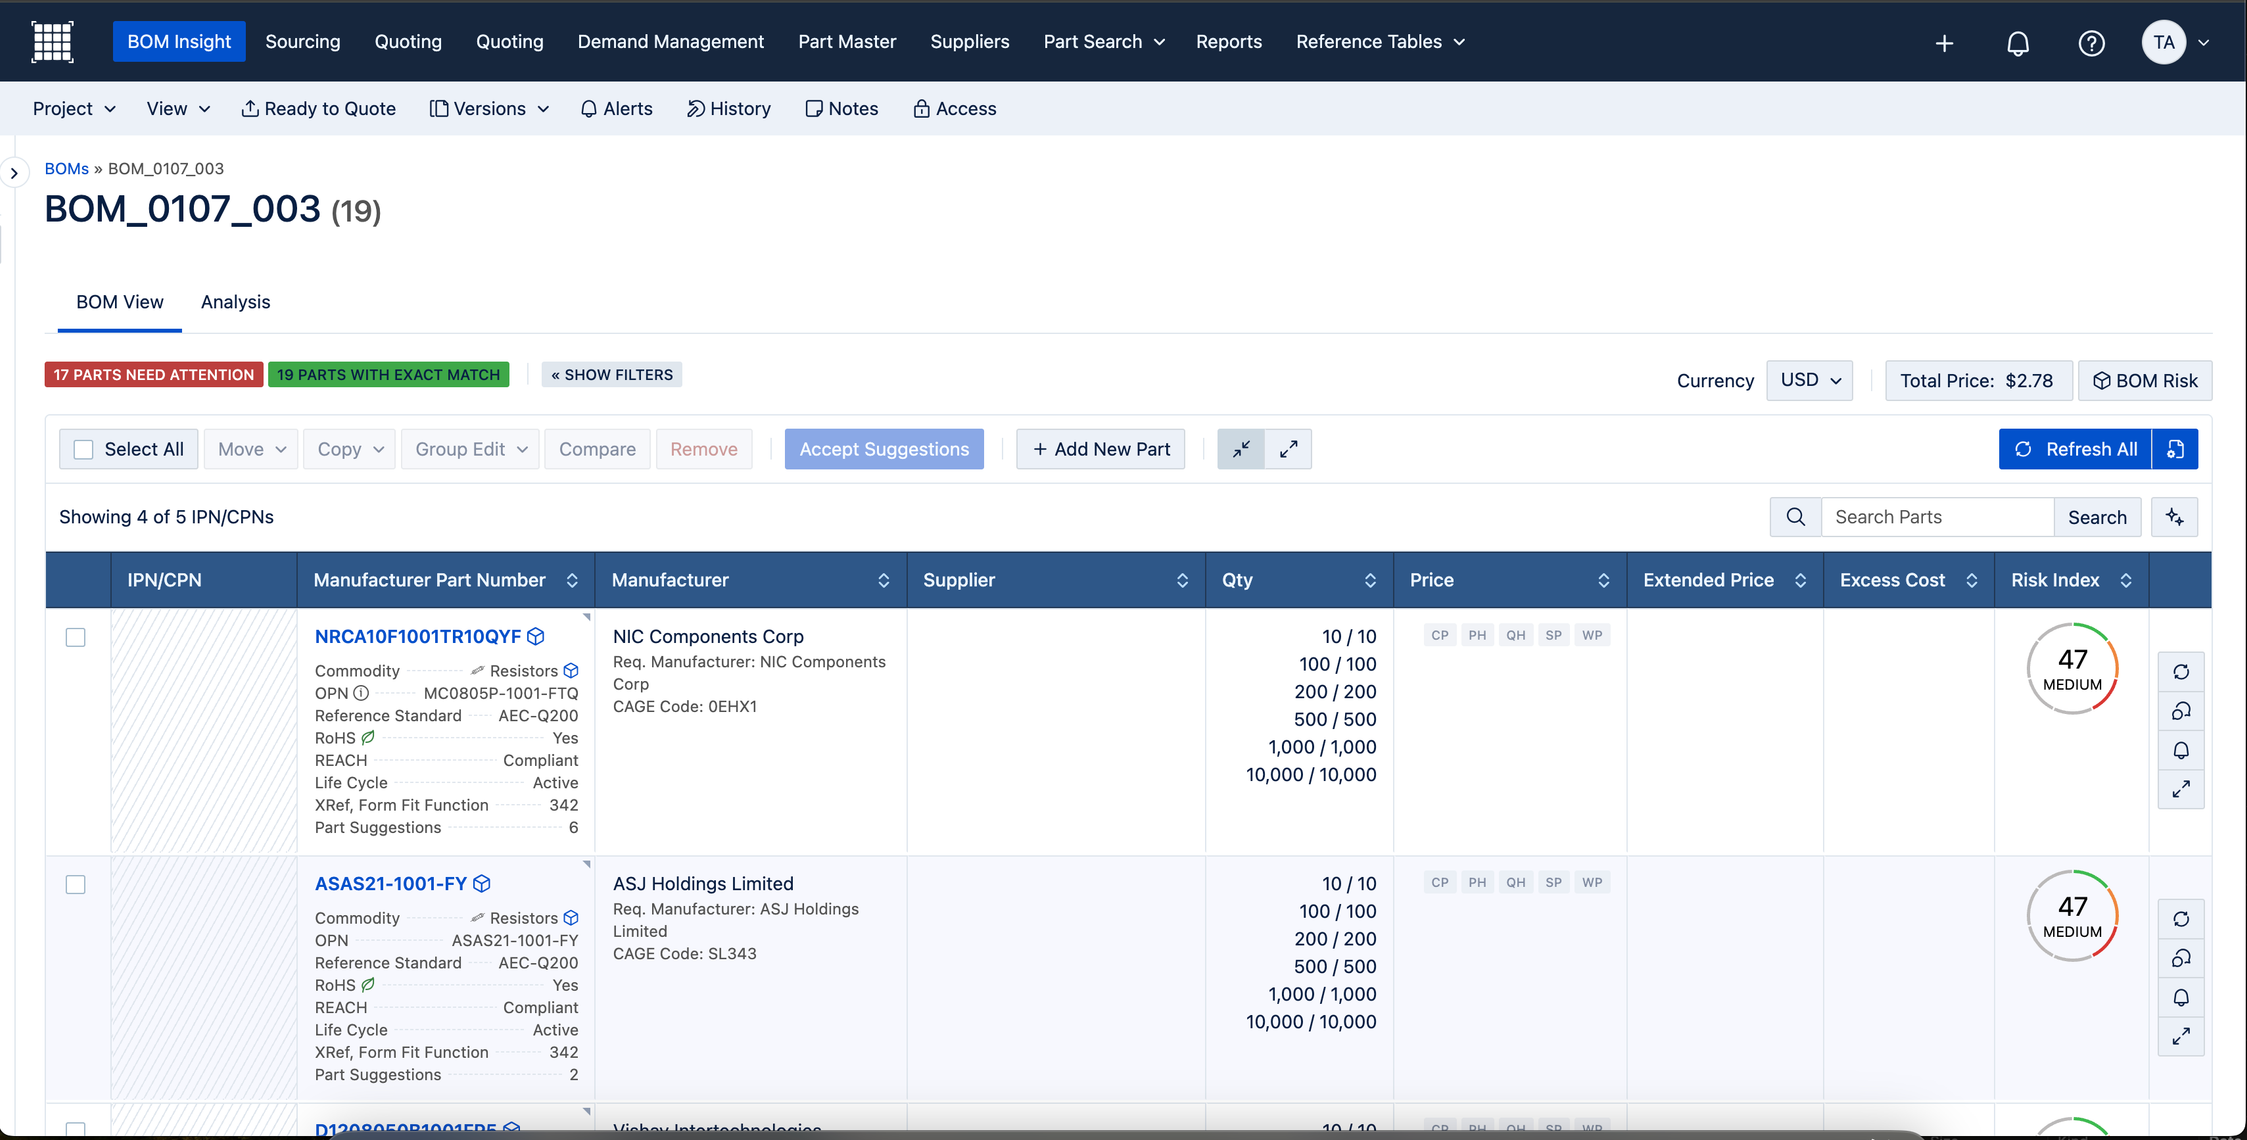
After — Risk Index
The old RiskRank column alongside the new Risk Index gauge in the redesigned BOM table.
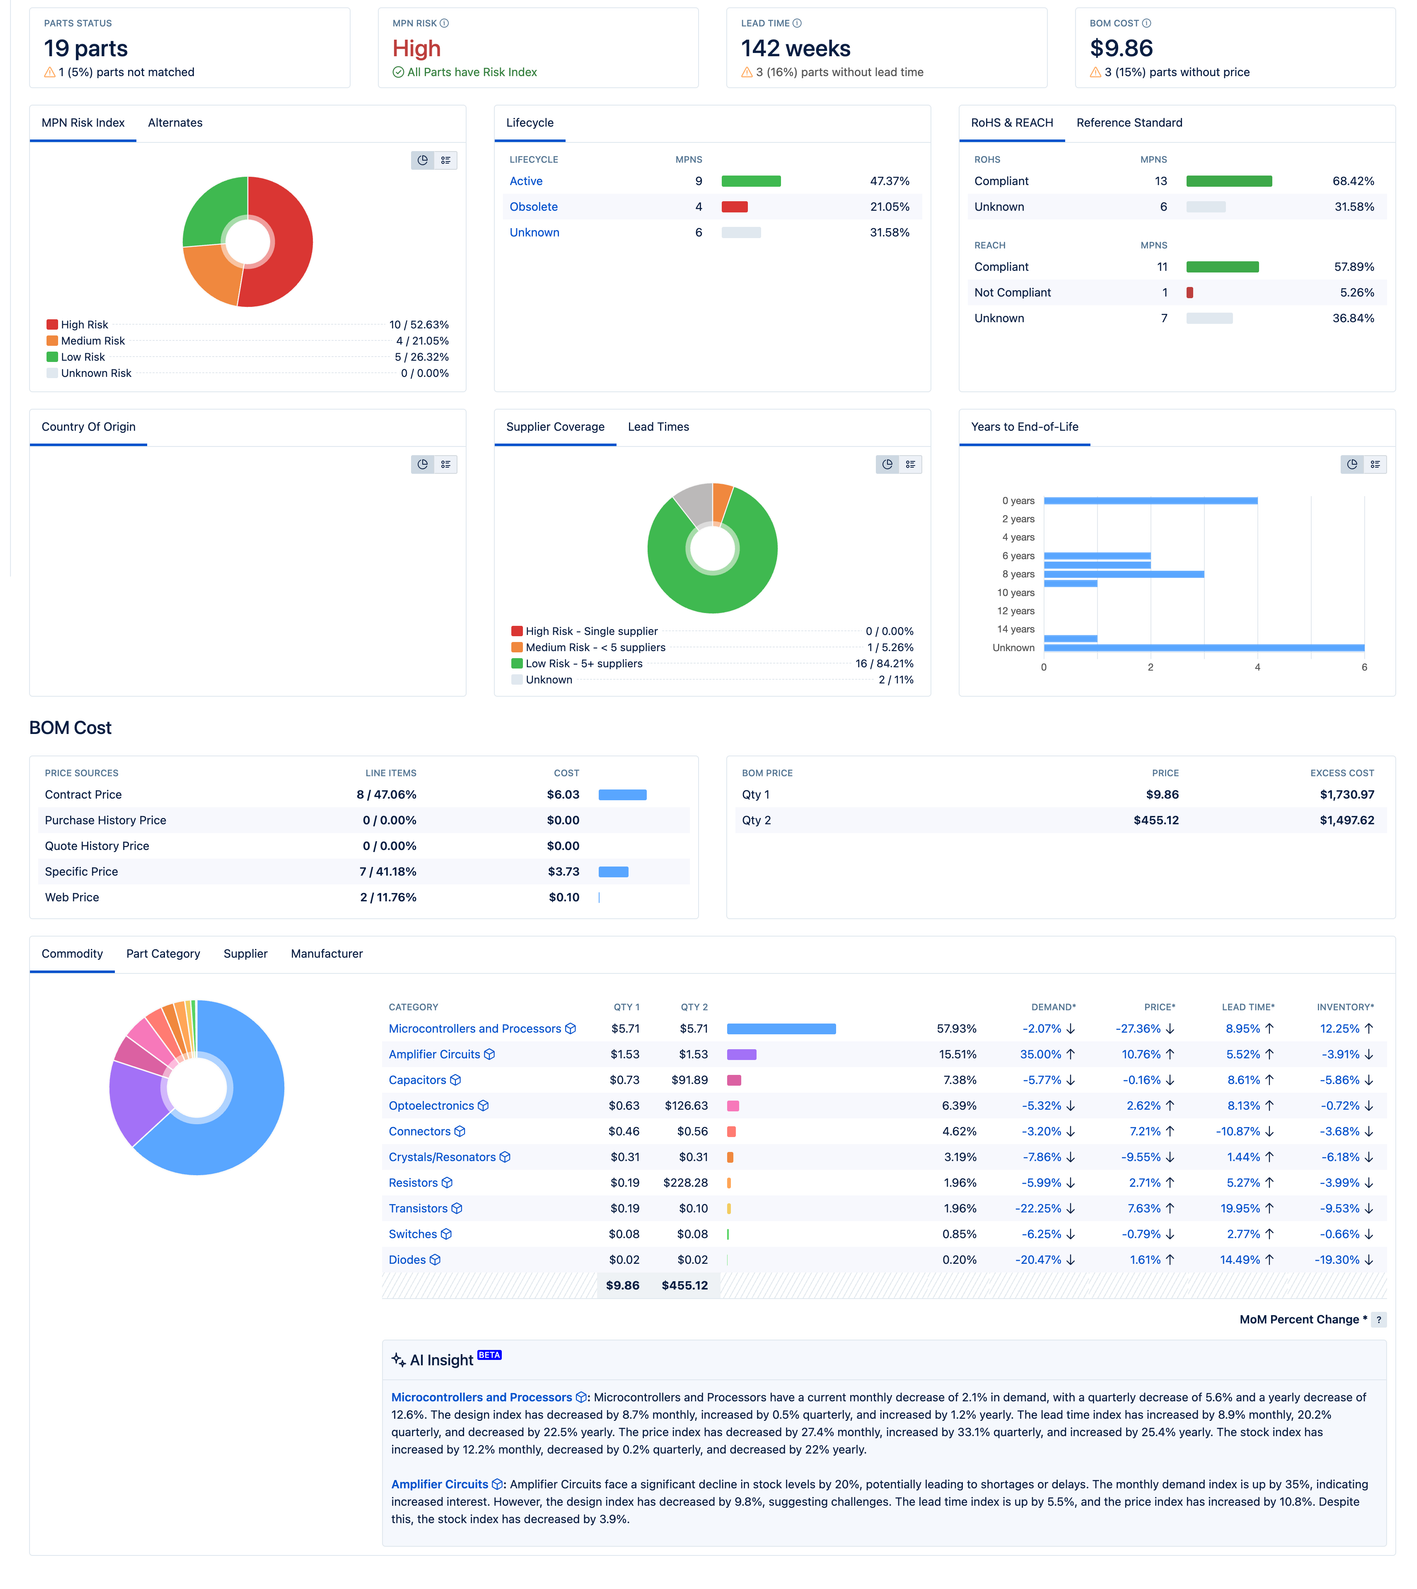
Analysis view: Risk in context
The BOM Analysis tab pulls Risk Index data into a dashboard alongside lifecycle status, supplier coverage, lead times, and compliance flags. Designed for procurement leads who need to assess risk across an entire bill of materials — not part by part, but at portfolio level.
◆ Results
From black box to competitive advantage
100%
of customers built a custom index
14
indexes built by a single customer
0
training sessions required for adoption
Customer Feedback
“We’re excited to see the ‘why’ behind the risk.”
Manager, Global Security Technology Leader
“That’s great! Everyone has a risk calculation, but it’s always a black box.”
Executive, Global Semiconductor Equipment Supplier
Stock availability and price were the two most common parameters, revealing risk priorities not captured by the old algorithm. Configuration was intuitive enough that teams started building indexes on their own — without training or a rollout campaign.